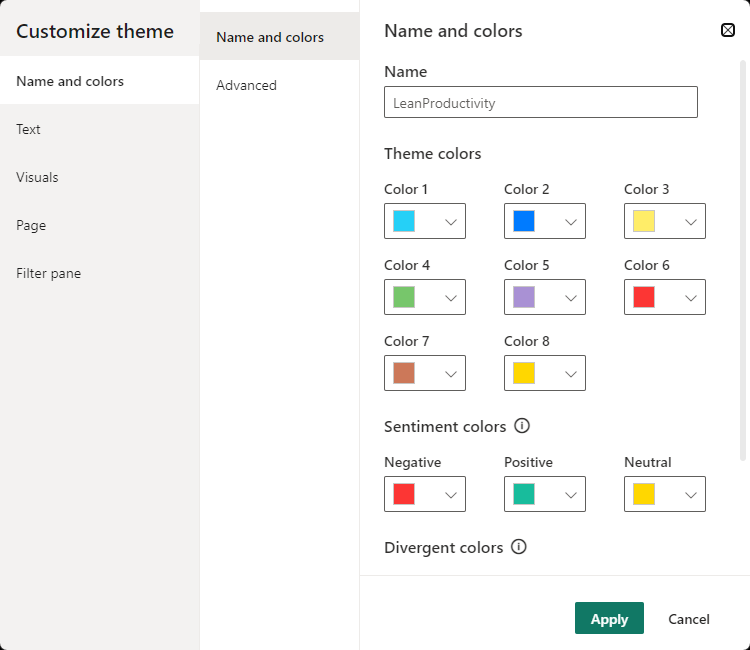
Theme colors
This includes definitions that are not related to a specific visual but rather to the whole theme. It includes:
"data colors"- these colors will be used for shapes representing data; the first eight Data Colors will show up in the Power BI color selector"bad","neutral","good"- sentiment colors for Bad, Neutral, Good formatting in waterfall and KPI visuals"minimum","center","maximum"- colors for gradients in visuals supporting Minimum, Center, Maximum conditional formatting
Syntax
{
    "name": "LeanProductivity",
    "dataColors": [
        "#25D0F7",
        "#007BFF",
        "#FFED68",
        "#77C66B",
        "#A991D4",
        "#FC3634",
        "#CC7859",
        "#FFD700",
        "#3498DB",
        "#46607E"
    ],
    "bad": "#FC3634",
    "neutral": "#FFD700",
    "good": "#18BC9C",
    "minimum": "#FEAFAE",
    "center": "#FD5E5D",
    "maximum": "#FC3634",
    "null": "#FF7F48"
}
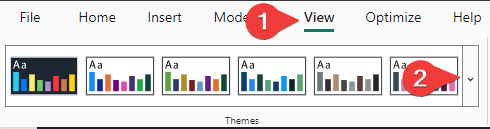
Settings