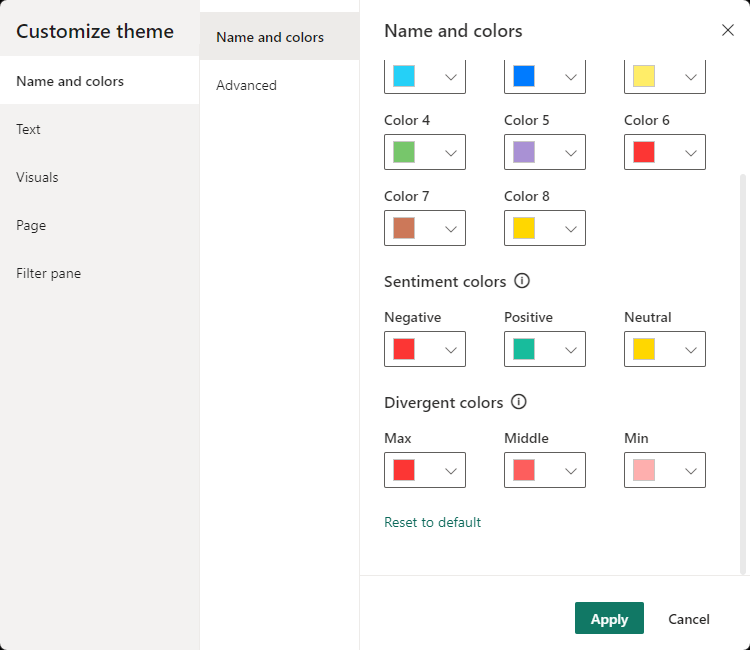
Minimum, Center, Maximum
The properties "minimum", "center", and "maximum" define the color scale for a visual element based on a range of values. They specify colors that represent the minimum, center, and maximum values within that range.
For example, you might use the "minimum" color to indicate the lowest values, the "center" color to represent mid-range values, and the "maximum" color to signify the highest values either in visuals, or when you use conditional formatting.
This color scale helps users quickly identify the relative significance or magnitude of data points within a visual element, facilitating a more intuitive interpretation of data in your Power BI reports and dashboards.
Syntax
{
    "name": "LeanProductivity",
    "minimum": "#FEAFAE",
    "center": "#FD5E5D",
    "maximum": "#FC3634"
}
Settings