Area Chart
Depending on the chart type, some properties listed in Visual Styles, can be customized for this chart type, too. While the respective code is in the JSON file, it is disabled and the chart will inherit the shared properties from the "visualStyles" section.
This is done by adding a _ to the property name.
E.g.:
Under "visualStyles/*/*", there is a property called "title".
The same property can be customized for this chart. To inherit the settings from the "visualStyles" section, I renamed the property for in the chart section to "title_". If you want to customize the "title" settings for this chart type, just rename it to "title" in the chart section of the JSON file.
The "areaChart" section is not to be confused with the Stacked Area Chart.
Syntax
{
    "name": "LeanProductivity",
    "visualStyles": {
		"areaChart": {
			"*": {
				"general_": [{
					"responsive": true
				}],
				"legend_": [{
					"show": true,
					"position": "Top",
					"showTitle": false,
					"titleText": "",
					"labelColor": { "solid": { "color": "#B3B3B3" } },
					"fontFamily": "Segoe UI",
					"fontSize": 10,
					"legendMarkerRendering": "markerOnly",
					"matchLineColor": false
				}],
				"categoryAxis": [{
					"show": true,
					"axisType_": "",
					"labelColor": { "solid": { "color": "#B3B3B3" } },
					"fontSize": 10,
					"fontFamily": "Segoe UI",
					"preferredCategoryWidth": 30,
					"maxMarginFactor": 28,
					"concatenateLabels": false,
					"showAxisTitle": true,
					"axisStyle": "showTitleOnly",
					"titleColor": { "solid": { "color": "#B3B3B3" } },
					"titleText": "",
					"titleFontSize": 11,
					"titleFontFamily": "Segoe UI"
				}],
				"valueAxis": [{
					"show": true,
					"position": "Right",
					"axisScale": "Linear",
					"start": 0,
					"end": "",
					"labelColor": { "solid": { "color": "#B3B3B3" } },
					"fontSize": 10,
					"fontFamily": "Segoe UI",
					"labelDisplayUnits_": 0,
					"labelPrecision_": "Auto",
					"showAxisTitle": true,
					"axisStyle": "showTitleOnly",
					"color": { "solid": { "color": "B3B3B3" } },
					"titleText": "",
					"titleFontSize": 11,
					"titleFontFamily": "Segoe UI",
					"gridlineShow": true,
					"gridlineColor": { "solid": { "color": "#B3B3B3" } },
					"gridlineThickness": 2,
					"gridlineStyle": "dotted"
				}],
				"dataPoint_": [{
					"defaultColor_": { "solid": { "color": "" } }
				}],
				"labels_": [{
					"show": true,
					"color": { "solid": { "color": "#FFFFFF"}},
					"labelDisplayUnits": 0,
					"labelPrecision": 1,
					"fontSize": 10,
					"fontFamily": "wf_standard-font, helvetica, arial, sans-serif",
					"enableBackground": false,
					"backgroundColor": { "solid": { "color": "#1C1C1C"}},
					"backgroundTransparency": 30
				}],
				"lineStyles": [{
					"strokeWidth": 2,
					"strokeLineJoin": "round",
					"lineStyle": "dashed",
					"showMarker": true,
					"markerShape": "circle",
					"markerSize": 5,
					"markerColor_": { "solid": { "color": "#FFFFFF"}}
				}],
				"plotArea_": [{
					"transparency": 20
				}]
			}
		}
    }
}
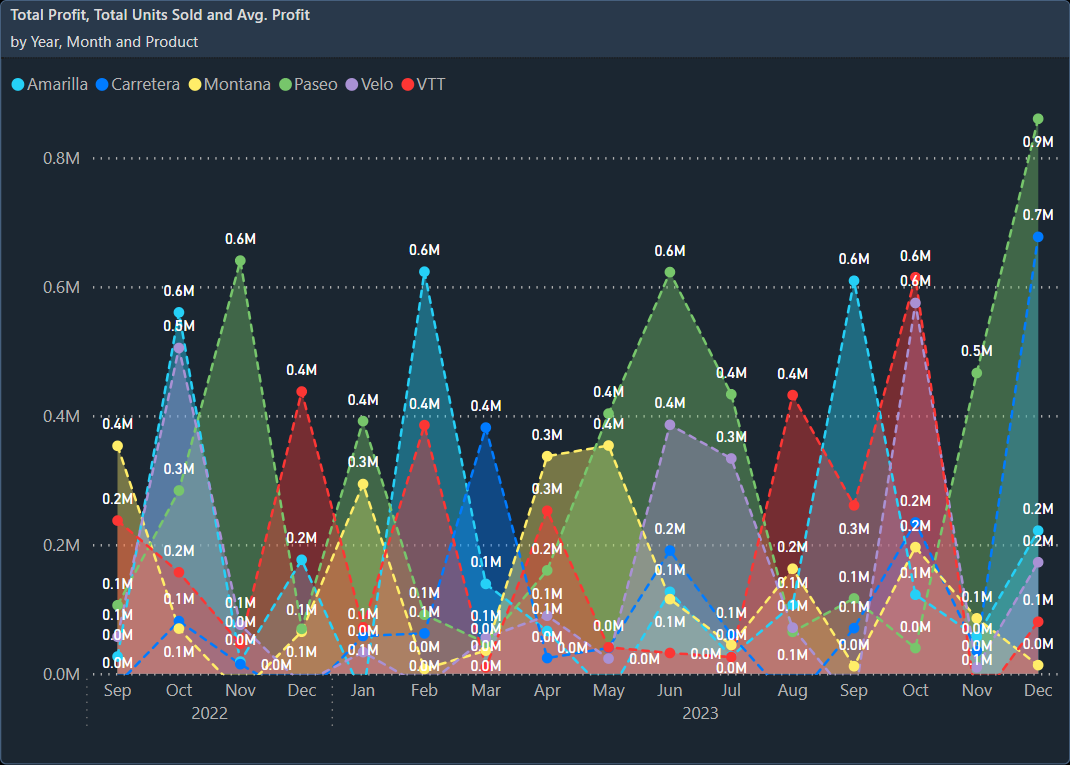
Effect
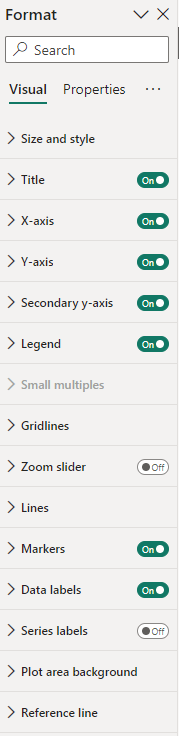
Settings